
?????. Is there any such thing? Temperature measurements and proxies. ? Manipulation . Natural cycles. What are the meaningful trends? https://tgrule.wordpress.com/carbon-attack/global-average-temperature/
[edit] CopyrightThis figure was prepared byis available from [3]. Image from Global Warming Art
This image is an original work created for Global Warming Art. Please refer to the image description page for more information.
[edit] Caveats
[edit] Notes
[edit] Additional References
[edit] derivative worksDerivative works of this file: File historyClick on a date/time to view the file as it appeared at that time.
File usage on CommonsThe following 9 pages link to this file:
File usage on other wikisThe following other wikis use this file:
Retrieved from “http://commons.wikimedia.org/w/index.php?title=File:Holocene_Temperature_Variations.png&oldid=57687523“
Personal toolsLanguage selectQafár afАҧсуаAcèhAfrikaansAkanGegëAlemannischአማርኛAragonésÆngliscअङ्गिकाالعربيةܐܪܡܝܐMapudungunMaġribiمصرىঅসমীয়াAsturianuАварKotavaAymar aruAzərbaycancaБашҡортсаBoarischŽemaitėškaبلوچی مکرانیBikol CentralБеларускаяБеларуская (тарашкевіца)Беларуская (тарашкевіца)БългарскиभोजपुरीभोजपुरीBislamaBahasa BanjarBamanankanবাংলাབོད་ཡིགইমার ঠার/বিষ্ণুপ্রিয়া মণিপুরীبختياريBrezhonegBráhuíBosanskiᨅᨔ ᨕᨘᨁᨗБуряадCatalàChavacano de ZamboangaMìng-dĕ̤ng-ngṳ̄НохчийнCebuanoChamoruChoctawᏣᎳᎩTsetsêhestâheseکوردیCorsuCapiceñoNēhiyawēwin / ᓀᐦᐃᔭᐍᐏᐣQırımtatarcaQırımtatarca (Latin)Къырымтатарджа (Кирилл)ČeskyKaszëbscziСловѣ́ньскъ / ⰔⰎⰑⰂⰡⰐⰠⰔⰍⰟЧӑвашлаCymraegDanskDeutschÖsterreichisches DeutschSchweizer HochdeutschDeutsch (Sie-Form)ZazakiDolnoserbskiDusun Bundu-liwanދިވެހިބަސްཇོང་ཁEʋegbeΕλληνικάEmiliàn e rumagnòlEnglishBritish EnglishEsperantoEspañolEestiEuskaraEstremeñuفارسیFulfuldeSuomiVõroNa Vosa VakavitiFøroysktFrançaisFrançais cadienArpetanNordfriiskFurlanFryskGaeilgeGagauz贛語赣语(简体)贛語(繁體)GàidhligGalegoگیلکیAvañe’ẽ𐌲𐌿𐍄𐌹𐍃𐌺Ἀρχαία ἑλληνικὴAlemannischગુજરાતીGaelgهَوُسَHak-kâ-faHawai`iעבריתहिन्दीFiji HindiFiji HindiIlonggoHiri MotuHrvatskiHornjoserbsceKreyòl ayisyenMagyarՀայերենOtsihereroInterlinguaBahasa IndonesiaInterlingueIgboꆇꉙIñupiakᐃᓄᒃᑎᑐᑦinuktitutIlokanoГІалгІай ĞalğajIdoÍslenskaItalianoᐃᓄᒃᑎᑐᑦ/inuktitut日本語PatiosLojbanJyskBasa JawaქართულიQaraqalpaqshaTaqbaylitАдыгэбзэАдыгэбзэKongoکھوارGĩkũyũKırmanckiKwanyamaҚазақшаقازاقشا (تٴوتە)Қазақша (кирил)Qazaqşa (latın)قازاقشا (جۇنگو)Қазақша (Қазақстан)Qazaqşa (Türkïya)Kalaallisutភាសាខ្មែរಕನ್ನಡ한국어한국어 (조선)Перем КомиKanuriКъарачай-МалкъарKrioKinaray-aकश्मीरी – (كشميري)كشميريकश्मीरीRipoarischKurdîKurdî (latînî)كوردي (عەرەبی)КомиKernowekКыргызчаLatinaLadinoLëtzebuergeschЛаккуЛезгиLingua Franca NovaLugandaLimburgsLíguruLīvõ kēļLumbaartLingálaລາວSiloziLietuviųLatgaļuLatviešu文言LazuriमैथिलीBasa BanyumasanМокшеньMalagasyEbonОлык МарийMāoriBaso MinangkabauМакедонскиമലയാളംМонголМолдовеняскэमराठीКырык марыBahasa MelayuMaltiMvskokeMirandésမြန်မာဘာသာЭрзяньمازِرونیDorerin NaoeroNāhuatlBân-lâm-gúNnapulitanoNorsk (bokmål)PlattdüütschNedersaksischनेपालीनेपाल भाषाOshiwamboNiuēNederlandsNederlands (informeel)Norsk (nynorsk)Norsk (bokmål)NovialNouormandSesotho sa LeboaDiné bizaadChi-ChewaOccitanOromooଓଡ଼ିଆИронਪੰਜਾਬੀPangasinanKapampanganPapiamentuPicardDeitschPlautdietschPälzischपािऴNorfuk / PitkernPolskiPiemontèisپنجابیΠοντιακάPrūsiskanپښتوPortuguêsPortuguês do BrasilRuna SimiRuna shimiRumagnôlTarifitRumantschRomaniKirundiRomânăArmãneashceTarandíneРусскийРусиньскыйArmãneashceVlăheşteВлахестеVlăheşteKinyarwandaसंस्कृतСаха тылаSarduSicilianuScotsسنڌيSassaresuSámegiellaCmique ItomSängöŽemaitėškaSrpskohrvatski / СрпскохрватскиTašlḥiytසිංහලSimple EnglishSlovenčinaSlovenščinaSchläschGagana SamoaÅarjelsaemienchiShonaSoomaaligaShqipСрпски / SrpskiСрпски (ћирилица)Srpski (latinica)SranantongoSiSwatiSesothoSeelterskBasa SundaSvenskaKiswahiliŚlůnskiதமிழ்ತುಳುతెలుగుTetunТоҷикӣТоҷикӣtojikīไทยትግርኛTürkmençeTagalogSetswanalea faka-TongaToki PonaTok PisinTürkçeXitsongaТатарча/TatarçaТатарчаTatarçachiTumbukaTwiReo Mā`ohiТыва дылУдмуртئۇيغۇرچە / UyghurcheئۇيغۇرچەUyghurcheУкраїнськаاردوO’zbekTshivendaVènetoVepsan kel’Tiếng ViệtWest-VlamsMainfränkischVolapükVaďďaVõroWalonWinarayWolof吴语ХальмгisiXhosaმარგალურიייִדישYorùbá粵語VahcuenghZeêuws中文文言中文(中国大陆)中文(简体)中文(繁體)中文(香港)Bân-lâm-gú中文(澳門)中文(马来西亚)中文(新加坡)中文(台灣)粵語isiZulu
Participate
Cancel Edit Delete Preview revert Text of the note (may include Wiki markup) Could not save your note (edit conflict or other problem). Please copy the text in the edit box below and insert it manually by editing this page.
Upon submitting the note will be published multi-licensed under the terms of the CC-BY-SA-3.0 license and of the GFDL, versions 1.2, 1.3, or any later version. See our terms of use for more details.
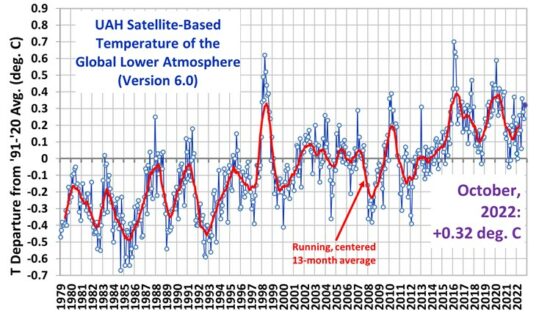
Add a note Draw a rectangle onto the image above (press the left mouse button, then drag and release). This file has annotations. Move the mouse pointer over the image to see them. To edit the notes, visit page X. Why do you want to remove this note? translate Save [[MediaWiki talk:Gadget-ImageAnnotator.js|Adding image note]]$1 [[MediaWiki talk:Gadget-ImageAnnotator.js|Changing image note]]$1 [[MediaWiki talk:Gadget-ImageAnnotator.js|Removing image note]]$1 Now things get interesting http://www.surfacestations.org/ One of temp source variables. UAH Global Temperature Update for August, 2011: +0.33 deg. C By Dr. Roy Spencer The global average lower tropospheric temperature anomaly for August, 2011 retreated a little, to +0.33 deg. C (click on the image for a LARGE version): Here are the stats…we are beginning to see cooling in the tropics from La Nina conditions which are re-emerging there: YR MON GLOBAL NH SH TROPICS The global sea surface temperatures from AMSR-E through the end of August are shown next. The trend line is, again, for entertainment purposes only:
CURRENT MEASUREMENTS/COMPUTATIONS: Climate Widget records: Jan 11 TA 0.0 SS 17 Feb 11 TA -0.01 SS 30 Mar 11 TA -0.1 SS 55 Apr 11 TA 0.22 SS 54 May 11 TA 0.23 SS 40 (prior – est from graphs). June 11: TA 0.31 degC; CO2 391.4; Sunspot 61 (then 128); Solar Flux 90 (then 120) per WUWT (rev 1/8) July 11: TA 0.37 degC; CO2 391.4; SS 119 (then 54); SF 98 (then92) per WUWT (rev 10/8). [Revised again 11/8: CO2 – 391.8, SS -12, SF – 87.] On 23/8 SS became 66, SF became 104. Still trying to understand this as I thought the figures were monthly totals! Here we go again: 25/8 SS=75, SF = 104, still labelled July. 2/9 still labelled July SS 109 SF 124 3/9: direct from wuwt – TA 0.33 then widget CO2 391.8 SS 109 SF 124 13/9 Widget update – Aug TA 0.33, then as above. 26/9 Update: SS =108, SF = 169 06/10 Sept GTA 0.29, CO2 391.7, SS 126, SF 129 Interesting cooling trend! 05/11 Oct GTA 0.11, Sept CO2 392.3, (?oct ) SS 161, SF 169. c.23/11 Oct GTA 0.11, Oct CO2 392.22, [less if you believe the accuracy is possible, maybe following the decreasing GTA :-)] SS 101, SF 141. by 16/12 Nov GTA 0.12, SS = 70, SF = 132 http://www.warwickhughes.com/icecore/IceCoreSprg97.pdf one method under scrutiny | Magyar | Italiano | 日本語 | ქართული | ភាសាខ្មែរ | 한국어 | Lietuvių | Македонски | മലയാളം | Plattdüütsch | Nederlands | Norsk (nynorsk) | Norsk (bokmål) | Polski | Português | Português do Brasil | Română | Русский | Српски / Srpski | Svenska | ไทย | Türkçe | Українська | Tiếng Việt | 中文 | 中文(简体) | 中文(繁體) | +/− |
|||||||||||||||||||||||||||||||||


I am in fact pleased to glance at this webpage posts which
includes lots of useful facts, thanks for providing these
kinds of data.
https://kinogoo.cc/
https://kinogo2.eu