History:
File:Holocene Temperature Variations.png
From Wikimedia Commons, the free media repository
 No higher resolution available.
[edit] Summary

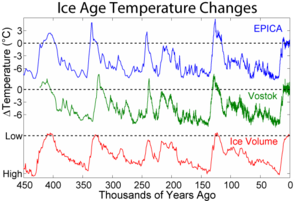
Temperature changes observed in Antarctica during the ice ages
The main figure shows eight records of local temperature variability on multi-centennial scales throughout the course of the Holocene, and an average of these (thick dark line). The data are for the period from 10000 BC to 2000 CE, which is from 12000 BP to the present time. The records are plotted with respect to the mid 20th century average temperature, and the global average temperature in 2004 is indicated. An inset plot compares the most recent two millennia of the average to other recent reconstructions. At the far right of this plot it is possible to observe the emergence of climate from the last glacial period of the current ice age. During the Holocene itself, there is general scientific agreement that temperatures on the average have been quite stable compared to fluctuations during the preceding glacial period. The above average curve supports this belief. However, there is a slightly warmer period in the middle which might be identified with the proposed Holocene climatic optimum. The magnitude and nature of this warm event is disputed, and it may have been largely limited to high northern latitudes.
Because of the limitations of data sampling, each curve in the main plot was smoothed (see methods below) and consequently, this figure can not resolve temperature fluctuations faster than approximately 300 years. Further, while 2004 appears warmer than any other time in the long-term average, and hence might be a sign of global warming, it should also be noted that the 2004 measurement is from a single year (actually the fourth highest on record, see Image:Short Instrumental Temperature Record.png for comparison). It is impossible to know whether similarly large short-term temperature fluctuations may have occurred at other times, but are unresolved by the available resolution. The next 150 years will determine whether the long-term average centered on the present appears anomalous with respect to this plot.
Since there is no scientific consensus on how to reconstruct global temperature variations during the Holocene, the average shown here should be understood as only a rough, quasi-global approximation to the temperature history of the Holocene. In particular, higher resolution data and better spatial coverage could significantly alter the apparent long-term behavior (see below for further caveats). For another estimate of Holocene temperature fluctuations, see: [1]
While any conclusions to be drawn from the long-term average must be considered crude and potentially controversial, one can comment on a number of well established inferences from the individual curves contributing to the average. First, at many locations, there exist large temperature fluctuations on multi-centennial scales. Hence, climate change lasting for centuries appears to be a common feature of many regions. Assuming the timing information from these records is reasonably accurate, it appears that in many cases large changes at any particular site may occur without correlating to similarly large changes at other sites. Secondly, it is also notable that different locations appear to take different amounts of time to reach typical Holocene conditions following the last glacial termination. Scientists generally agree that warming concluded in the far Southern Hemisphere earlier than in most other regions. In part, the prolonged climate change may be related to prolonged changes in sea level, which took till roughly 6000 years ago to reach near modern levels. Some of the differences may also reflect timescale uncertainties.
| Dragons flight’s Temperature Record Series |
| This figure is part of series of plots created by Dragons flight to illustrate changes in Earth‘s temperature and climate across many different time scales. |
| Time Period: 25 yrs | 150 yrs | 1 kyr | 2 kyr | 12 kyr | 450 kyr | 5 Myr | 65 Myr | 500 Myr |
| For articles related to this topic see: Temperature record |
 |
This graph image could be recreated using vector graphics as an SVG file. This has several advantages; see Commons:Media for cleanup for more information. If an SVG form of this image is already available, please upload it. After uploading an SVG, replace this template with {{vector version available|new image name.svg}}. | ||||||||||||||||||||||||||||||||
|
[edit] Methods To construct this plot, eight data sources (listed below) were selected on the basis of good temporal resolution (preferably ~100 years or less per data point) and coverage of the last 12 kyr. Six of the eight specifically reported temperature and were used as is. The other two reported unscaled temperature proxies and were scaled as described in Notes below. Each curve was smoothed by a Gaussian weighted filter to produce a history of the Holocene temperature variations at that site with approximately 300 year resolution (one exception, see notes). These smooth curves were adjusted to have the same mean over the interval 100-6000 years BP. The average of these curves was then constructed, and the alignment relative to modern day determined by comparing the average over the interval 250-1900 AD relative to the three short-term proxies shown in inset (for details on those plots, see: Image:2000 Year Temperature Comparison.png). Note that the short-term proxies are not at all used in constructing the average itself. [edit] Data SourcesThe following data sources were used in constructing the main plot:
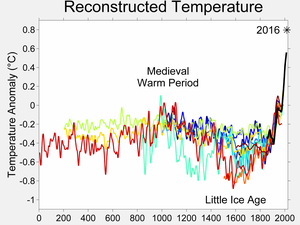
Additional data used in inset plot and for matching temperature scale to modern values. Colors match those used in Image:2000 Year Temperature Comparison.png.
[edit] CopyrightThis figure was prepared by Robert A. Rohde from publicly available data and is incoporated into the Global Warming Art project. Most, but not all, of the original data is available from [3]. Image from Global Warming Art
This image is an original work created for Global Warming Art. Please refer to the image description page for more information.
[edit] Caveats
[edit] Notes
[edit] Additional References
[edit] derivative worksDerivative works of this file: File historyClick on a date/time to view the file as it appeared at that time.
File usage on CommonsThe following 9 pages link to this file:
File usage on other wikisThe following other wikis use this file:
Retrieved from “http://commons.wikimedia.org/w/index.php?title=File:Holocene_Temperature_Variations.png&oldid=57687523“
Personal toolsLanguage selectQafár afАҧсуаAcèhAfrikaansAkanGegëAlemannischአማርኛAragonésÆngliscअङ्गिकाالعربيةܐܪܡܝܐMapudungunMaġribiمصرىঅসমীয়াAsturianuАварKotavaAymar aruAzərbaycancaБашҡортсаBoarischŽemaitėškaبلوچی مکرانیBikol CentralБеларускаяБеларуская (тарашкевіца)Беларуская (тарашкевіца)БългарскиभोजपुरीभोजपुरीBislamaBahasa BanjarBamanankanবাংলাབོད་ཡིགইমার ঠার/বিষ্ণুপ্রিয়া মণিপুরীبختياريBrezhonegBráhuíBosanskiᨅᨔ ᨕᨘᨁᨗБуряадCatalàChavacano de ZamboangaMìng-dĕ̤ng-ngṳ̄НохчийнCebuanoChamoruChoctawᏣᎳᎩTsetsêhestâheseکوردیCorsuCapiceñoNēhiyawēwin / ᓀᐦᐃᔭᐍᐏᐣQırımtatarcaQırımtatarca (Latin)Къырымтатарджа (Кирилл)ČeskyKaszëbscziСловѣ́ньскъ / ⰔⰎⰑⰂⰡⰐⰠⰔⰍⰟЧӑвашлаCymraegDanskDeutschÖsterreichisches DeutschSchweizer HochdeutschDeutsch (Sie-Form)ZazakiDolnoserbskiDusun Bundu-liwanދިވެހިބަސްཇོང་ཁEʋegbeΕλληνικάEmiliàn e rumagnòlEnglishBritish EnglishEsperantoEspañolEestiEuskaraEstremeñuفارسیFulfuldeSuomiVõroNa Vosa VakavitiFøroysktFrançaisFrançais cadienArpetanNordfriiskFurlanFryskGaeilgeGagauz贛語赣语(简体)贛語(繁體)GàidhligGalegoگیلکیAvañe’ẽ𐌲𐌿𐍄𐌹𐍃𐌺Ἀρχαία ἑλληνικὴAlemannischગુજરાતીGaelgهَوُسَHak-kâ-faHawai`iעבריתहिन्दीFiji HindiFiji HindiIlonggoHiri MotuHrvatskiHornjoserbsceKreyòl ayisyenMagyarՀայերենOtsihereroInterlinguaBahasa IndonesiaInterlingueIgboꆇꉙIñupiakᐃᓄᒃᑎᑐᑦinuktitutIlokanoГІалгІай ĞalğajIdoÍslenskaItalianoᐃᓄᒃᑎᑐᑦ/inuktitut日本語PatiosLojbanJyskBasa JawaქართულიQaraqalpaqshaTaqbaylitАдыгэбзэАдыгэбзэKongoکھوارGĩkũyũKırmanckiKwanyamaҚазақшаقازاقشا (تٴوتە)Қазақша (кирил)Qazaqşa (latın)قازاقشا (جۇنگو)Қазақша (Қазақстан)Qazaqşa (Türkïya)Kalaallisutភាសាខ្មែរಕನ್ನಡ한국어한국어 (조선)Перем КомиKanuriКъарачай-МалкъарKrioKinaray-aकश्मीरी – (كشميري)كشميريकश्मीरीRipoarischKurdîKurdî (latînî)كوردي (عەرەبی)КомиKernowekКыргызчаLatinaLadinoLëtzebuergeschЛаккуЛезгиLingua Franca NovaLugandaLimburgsLíguruLīvõ kēļLumbaartLingálaລາວSiloziLietuviųLatgaļuLatviešu文言LazuriमैथिलीBasa BanyumasanМокшеньMalagasyEbonОлык МарийMāoriBaso MinangkabauМакедонскиമലയാളംМонголМолдовеняскэमराठीКырык марыBahasa MelayuMaltiMvskokeMirandésမြန်မာဘာသာЭрзяньمازِرونیDorerin NaoeroNāhuatlBân-lâm-gúNnapulitanoNorsk (bokmål)PlattdüütschNedersaksischनेपालीनेपाल भाषाOshiwamboNiuēNederlandsNederlands (informeel)Norsk (nynorsk)Norsk (bokmål)NovialNouormandSesotho sa LeboaDiné bizaadChi-ChewaOccitanOromooଓଡ଼ିଆИронਪੰਜਾਬੀPangasinanKapampanganPapiamentuPicardDeitschPlautdietschPälzischपािऴNorfuk / PitkernPolskiPiemontèisپنجابیΠοντιακάPrūsiskanپښتوPortuguêsPortuguês do BrasilRuna SimiRuna shimiRumagnôlTarifitRumantschRomaniKirundiRomânăArmãneashceTarandíneРусскийРусиньскыйArmãneashceVlăheşteВлахестеVlăheşteKinyarwandaसंस्कृतСаха тылаSarduSicilianuScotsسنڌيSassaresuSámegiellaCmique ItomSängöŽemaitėškaSrpskohrvatski / СрпскохрватскиTašlḥiytසිංහලSimple EnglishSlovenčinaSlovenščinaSchläschGagana SamoaÅarjelsaemienchiShonaSoomaaligaShqipСрпски / SrpskiСрпски (ћирилица)Srpski (latinica)SranantongoSiSwatiSesothoSeelterskBasa SundaSvenskaKiswahiliŚlůnskiதமிழ்ತುಳುతెలుగుTetunТоҷикӣТоҷикӣtojikīไทยትግርኛTürkmençeTagalogSetswanalea faka-TongaToki PonaTok PisinTürkçeXitsongaТатарча/TatarçaТатарчаTatarçachiTumbukaTwiReo Mā`ohiТыва дылУдмуртئۇيغۇرچە / UyghurcheئۇيغۇرچەUyghurcheУкраїнськаاردوO’zbekTshivendaVènetoVepsan kel’Tiếng ViệtWest-VlamsMainfränkischVolapükVaďďaVõroWalonWinarayWolof吴语ХальмгisiXhosaმარგალურიייִדישYorùbá粵語VahcuenghZeêuws中文文言中文(中国大陆)中文(简体)中文(繁體)中文(香港)Bân-lâm-gú中文(澳門)中文(马来西亚)中文(新加坡)中文(台灣)粵語isiZulu
Participate |
|||||||||||||||||||||||||||||||||


